About 20 years ago, my father sold his home and put everything he had into properties in California and Texas. Cash flow was coming but the returns weren't there. While searching for a better market, he took us on a road trip hitting all the real estate hotspots across the country.
After more than a week of speaking to investors and brokers all over the country, he landed on Chicago South Side. On the surface, it didn't look like much but the numbers were some of the best we'd ever seen.
As I started my real estate business I started to learn the mechanism behind how investors make money in both unattractive markets like South Side Chicago and expensive markets like California with different strategies.
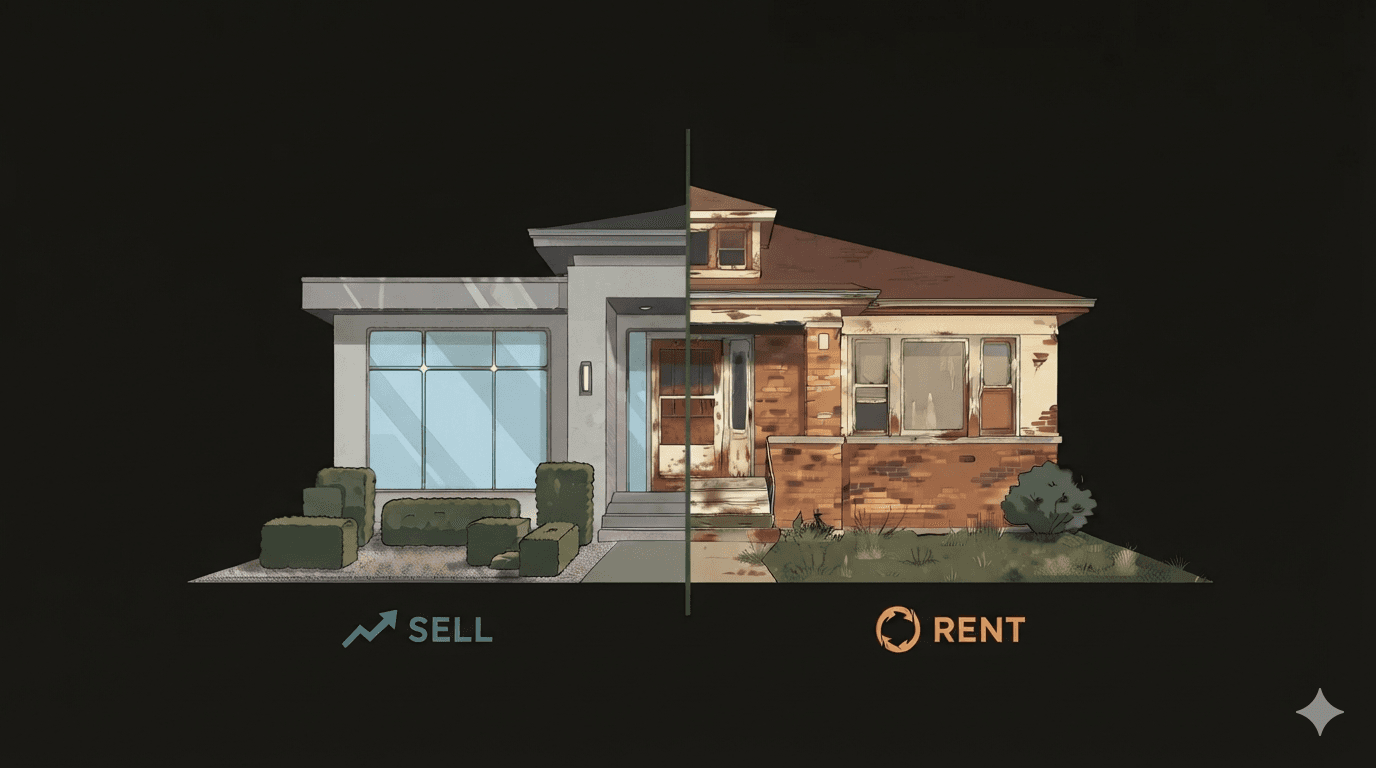
I call it “Sell to the rich, rent to the poor”.
The data behind it
Cheaper zip codes tend to produce significantly stronger net rental yields compared to pricier ones.
Rental yield data: According to NBER, net rental yields grow from 2.4% in the most expensive quintile to 6.1% in the cheaper quintile.
Flipping data: ATTOM's data shows flipping margins almost double from cheaper zip codes to pricier ones.
- U.S. metro
- Chicago
- Trend line
Data from Zillow. Assuming 35% operating expenses.
View underlying data
| Metro | Median price | Gross yield | Net yield |
|---|---|---|---|
| Toledo, OH | $204,000 | 7.66% | 5% |
| Pittsburgh, PA | $234,727 | 7.79% | 5.1% |
| Akron, OH | $241,000 | 6.57% | 4.3% |
| Memphis, TN | $246,954 | 6.97% | 4.5% |
| Cleveland, OH | $254,986 | 6.94% | 4.5% |
| New Orleans, LA | $264,193 | 7.34% | 4.8% |
| Detroit, MI | $270,689 | 6.73% | 4.4% |
| St. Louis, MO | $280,017 | 6.25% | 4.1% |
| Indianapolis, IN | $296,207 | 6.31% | 4.1% |
| Houston, TX | $307,273 | 6.44% | 4.2% |
| Chicago, IL | $359,897 | 7.59% | 4.9% |
| Tampa, FL | $359,973 | 6.73% | 4.4% |
| Dallas-Fort Worth, TX | $365,048 | 5.5% | 3.6% |
| Atlanta, GA | $381,729 | 5.83% | 3.8% |
| Charlotte, NC | $389,125 | 5.4% | 3.5% |
| Philadelphia, PA | $394,620 | 5.86% | 3.8% |
| Phoenix, AZ | $445,343 | 4.67% | 3% |
| Miami, FL | $476,638 | 6.79% | 4.4% |
| Washington, DC | $584,571 | 5.03% | 3.3% |
| Denver, CO | $571,808 | 4.05% | 2.6% |
| San Diego, CA | $940,304 | 3.82% | 2.5% |
| Los Angeles, CA | $965,867 | 3.64% | 2.4% |
| Seattle, WA | $742,220 | 3.67% | 2.4% |
| San Francisco, CA | $1,144,062 | 3.46% | 2.3% |
| San Jose, CA | $1,579,943 | 2.83% | 1.8% |
Net rental yield (%)
Gross flip margin (%)
View underlying data
| Income | Net rental yield | Gross flip margin |
|---|---|---|
| $20k | 11.8% | 12% |
| $35k | 10.5% | 14% |
| $50k | 8.2% | 17% |
| $70k | 6.3% | 20% |
| $90k | 5.1% | 24% |
| $110k | 4.4% | 28% |
| $130k | 4% | 31% |
| $140k | 3.9% | 33% |
| $160k | 3.8% | 35% |
While this is not a standard rule across markets, it's a strong correlation that tells us something very interesting about the way housing markets work.
Why this happens
The reason why these different investment models perform differently in opposing markets boils down to one thing: income source.
- Long term rentals (LTR) → Leverages cash-flow
- Short term flipping (STF) → Leverages both forced and market appreciation
Rule: In this blog, long term rentals = LTR and short term flipping = STF.
Reason 1: Pricing ceilings
In real estate, there are abstract pricing ceilings that limit the way prices can fluctuate. These ceilings look very different in low-income markets compared to high-income markets.
| Market | Selling | Renting |
|---|---|---|
| Lower-income markets | Hard price ceiling Fewer buyers + financing limitations = limits appreciation. | Higher rent ceiling Stronger rental demand + government assistance + shared housing = higher rent ceiling. |
| Higher-income markets | Softer price ceiling Buyers pay premiums for quality, luxury, location, and tax benefits. | Lower rent ceiling Lower rent demand + tighter rent control = lower rent ceiling. |
Here's how the different income strategies leverage these different ceiling tendencies in the different markets:
Investor strategy:
- Sell: Create value through renovations → Leverages soft pricing ceiling
- Rent: Maximize yield by minimizing acquisition and operating costs → Leverages higher rental ceiling
Reason 2: Demand distribution
Rental demand and home ownership demand also have a unique distribution within these markets.
Households earning under $50,000
Households earning $100,000 or more
Supplying the high demand is business 101 which is why investors tend to make more money where the demand is the highest.
Reason 3: Fixed costs
There is also a fixed-cost math behind this. Many renovation costs like labor, materials, kitchens, and bathrooms don't 10x with the property value. Costs stay relatively the same, but the value it creates can vary depending on the market.
A $50K renovation on a $200K home is 25% of its value but only 2.5% of a $2M home. Yet that 2.5% can meaningfully improve the home's appeal and help justify a higher sale price.
25%
of a $200k home's value
$50k renovation
2.5%
of a $2M home's value
$50k renovation
The same dollar of renovation can therefore generate a better return in a higher-value property.
The nuances
I'll be honest, this mechanism is not as simple as it seems and there are a couple of nuances and challenges with each market that are worth mentioning:
| Strategy | Challenge | How to overcome it |
|---|---|---|
| Long-term rentals in lower-income areas |
|
|
| Flips in higher-income areas |
|
|
There are always exceptions → Multifamily properties in large metropolitan areas can generate excellent rental yields despite being in high-income markets, while rapidly growing lower-income neighborhoods can produce outstanding flip returns.
What this means for investors
The takeaway here is to understand that every market has a different opportunity and a unique strategy. Investors should stop biting on the hottest and most attractive markets to invest in and instead focus on a model that they can scale and replicate.
The best thing about real estate is its replicability. You can find a successful investment company in an area, learn from their model, and do exactly what they're doing and do just as well.
If this kind of breakdown is useful, this is exactly the type of analysis we dig into every week — sign up for the newsletter below and we'll send the next one straight to you.